
Activity Pulse v1.1.0 OUT NOW!
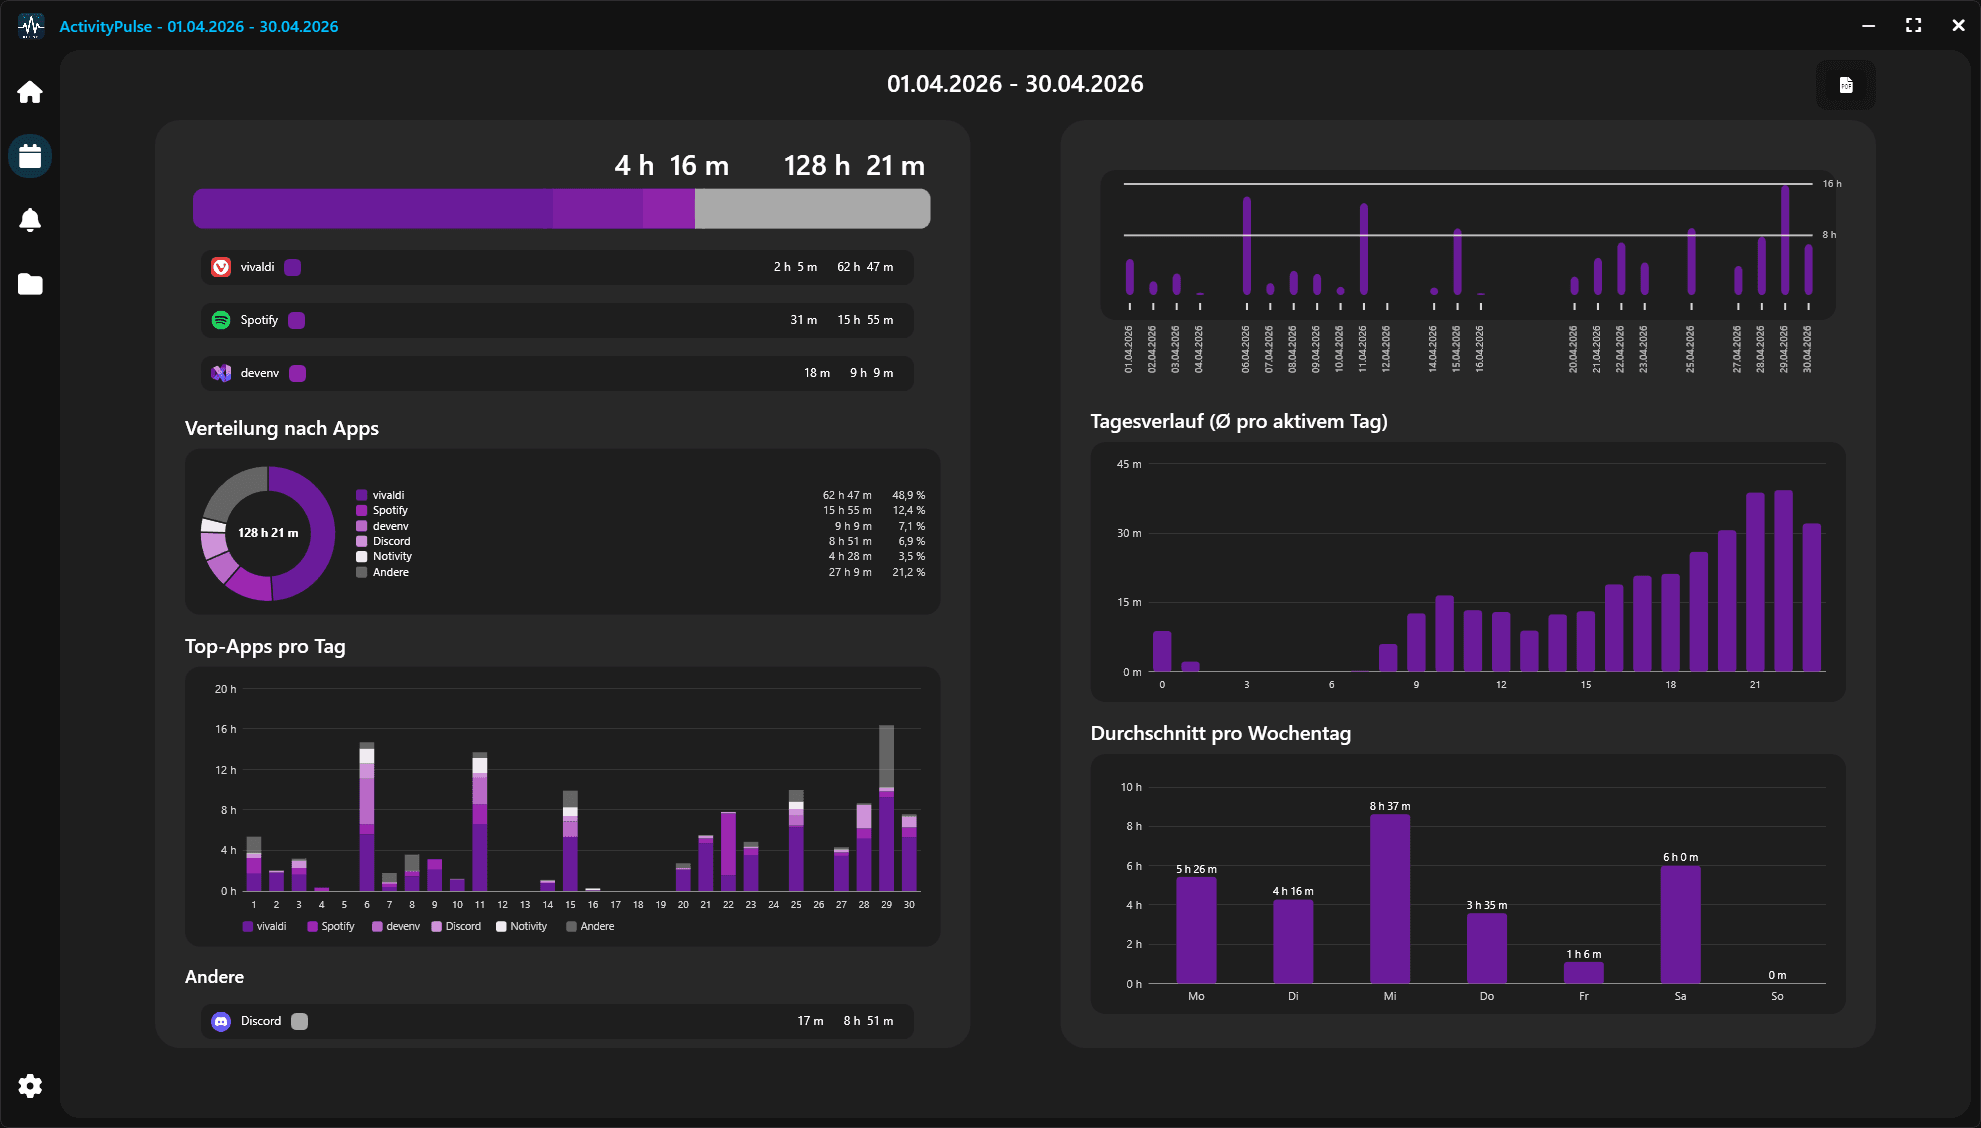
Your screen time, ready to keep: PDF export and new charts in ActivityPulse
ActivityPulse has always shown you how you spend time on your PC. With this update you can also take that overview with you. Weekly, monthly and yearly summaries can now be exported as PDF, and the summaries have five new charts.
Export your summaries as PDF
Every summary now has an export button in the top right corner. One click, choose where to save it, and you get a clean A4 report containing:
- Key figures for the period: total screen time, average per day, active days and your most active day
- Screen time per day, or per month in the yearly summary
- App distribution and how your top apps changed over time
- Your daily rhythm and average per weekday
- An activity calendar of the whole year
- A table of every app you used, with icon, total time, daily average and share
Whether you want to archive your year, compare months or just look back at how 2025 went, it's all in one document.
All your summaries in one place
Your data for a completed week, month or year can't change anymore, so there's no reason to recalculate it every time. ActivityPulse now saves these summaries automatically when you open them, and they open instantly the next time.
You'll find them on the new Summaries page in the sidebar. Filter by weeks, months or years, open any summary, export it as PDF or delete it.
Five new charts
The summary view got a lot more to show:
- App distribution: a donut chart of your top 5 apps and everything else
- Top apps per day/month: stacked bars showing which app dominated when
- Daily rhythm: your average activity for each hour of the day. Are you a morning person or a night owl?
- Average per weekday: which days you spend the most time at your PC
- Activity calendar: every day of the year as a colored square, in the style of a contribution graph
Every chart, including the existing ones, now has tooltips. Hover over a bar to see the exact date, the time and a breakdown by app.
The charts follow your selected theme and adapt to the window size. The PDF uses the very same charts, so what you see in the app is what you get on paper.
Bug fixes
- The monthly breakdown in the yearly summary was off when a month without any data was in between. That's fixed.
Get the update
ActivityPulse v1.1.0 is available now on our website. As always, we'd love to hear your feedback!
Your Adeptstack-Team